DB Time/DB CPU
The "Load Section" of an AWR Report has two interesting lines
- DB Time(s)
- DB CPU(s)
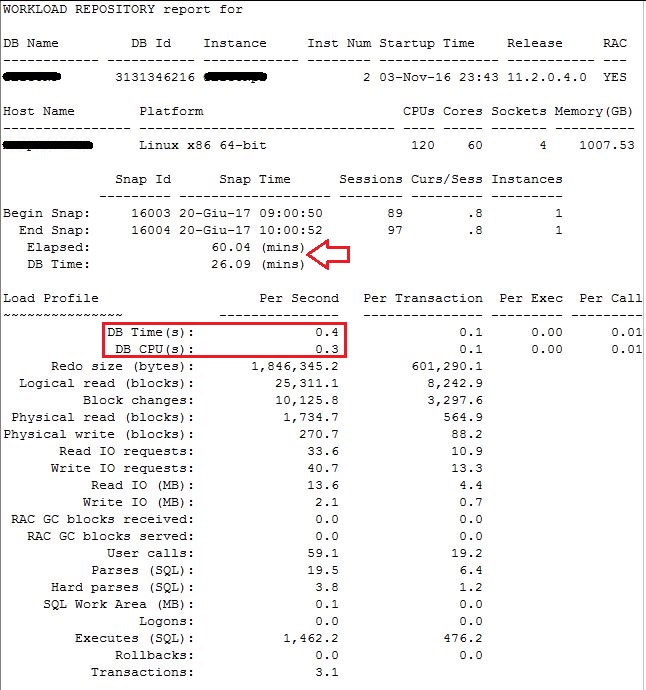 |
| Load Profile |
This "Load Profile" is an AWR snapshot of 1h (60m/3600s). Look at the definitions of those metrics.
- DB Time is a time model statistic that is the sum of Oracle process CPU consumption and non-idle wait time
- DB CPU is Oracle server/foreground/shadow process CPU consumption
(the above definitions are taken from an Orapub's Blog). Both of them are divided by "Elapsed Time" so they are an average on the snapshot interval.
Because of the definition of "DB Time", the "DB Time(s)" represent the Average Active Session on just one second.
"DB CPU(s)" tell us how many CPU are used in one second. You can compare this value with the number of CPU on your system, in order to understand if you are CPU bound.
In my example (from production system), the database is doing.....nothing: 1 active session each 2 seconds and a half (0.4 in 1s + 0,4 in 1s + 0.2 in 1/2s).
Also each 1s only 0.3 CPUs are used on 120 CPUs of the system (see next picture).
Utilization
How you can see from this Orapub post, the utilization is calculated as- Utilization = Requirement / Capacity (a)
(a) capacity: the maximum amount that can be contained or accommodated
From our point of view
- The requirement is the time used
- The capacity is the time available
so the previous formula became
- Utilization = time used / time available
You can calculate the utilization using two different methods. These methods are taken from Craig Shallahamer's Video Lessons.
- Core method
- Busy:Idle method
In order to explain these methods, I post another picture from AWR report
 |
| Operating System Statistics |
Core method
With this method, requirement and capacity are:
Requirement => (v$osstat.)BUSY_TIME
Capacity => #CPU * Elapsed (Time)
In AWR report, the "BUSY_TIME" came from V$OSSTAT, while "Elapsed" is the "Elapsed Time" of snapshot and #CPU is the number of CPU on the system (the NUM_CPU column of V$OSSTAT)
Remember to normalize the numbers
Utilization = BUSY_TIME / Elapsed = (3336707/100) / (120*60*60)
Utilization = 33367.07 / 432000
Utilization = 0,077
Utilization = 7,7%
Because BUSY_TIME is in hundredths of seconds, I had divided the BUSY_TIME by 100. Also, the "Elapsed Time" in AWR report is in minutes, I multiplicated it for 60.
Busy:Idle method
With this method, requirement and capacity are:
Requirement => (v$osstat.)BUSY_TIME
Capacity => (v$osstat.)BUSY_TIME + (v$osstat.)IDLE_TIME
In this case, all information comes from the "Operating System Statistics" section of AWR Report.
Utilization = BUSY_TIME / (BUSY_TIME + IDLE_TIME)
Utilization = 3336707 / (3336707 + 39244501)
Utilization = 3336707 / 42581208
Utilization = 0,078
Utilization = 7,8%
In this case, all measurement was in hundredths of seconds so no further operations are needed.
The low utilization is a confirm of the very low Average Active Section shown in firs part of this post.
Reference
* http://blog.orapub.com/20130228/how-many-cpu-cores-do-i-really-have-in-my-oracle-database-server.html* http://www.toadworld.com/platforms/oracle/b/weblog/archive/2014/05/26/understanding-cpu-utilization-amp-cpu-capacity
* http://blog.orapub.com/20140805/what-is-oracle-db-time-db-cpu-wall-time-and-non-idle-wait-time.html
* https://docs.oracle.com/database/122/REFRN/V-OSSTAT.htm#REFRN30321
Nessun commento:
Posta un commento